Chart views: count what a Rose Rocket board view keeps
Switch a board view to Charts, set each panel's chart type and Group by, and save it. Every panel counts only the records the view's filter keeps.
On this page3 sections
What it does
Once you know what a board view saves, a chart view is that same view with its Layout set to Charts: the rows give way to panels, and each panel counts the records the view holds. The view’s filter decides which records the chart can see, so a panel on a filtered view is a live report that redraws as orders move, not a snapshot someone exported.
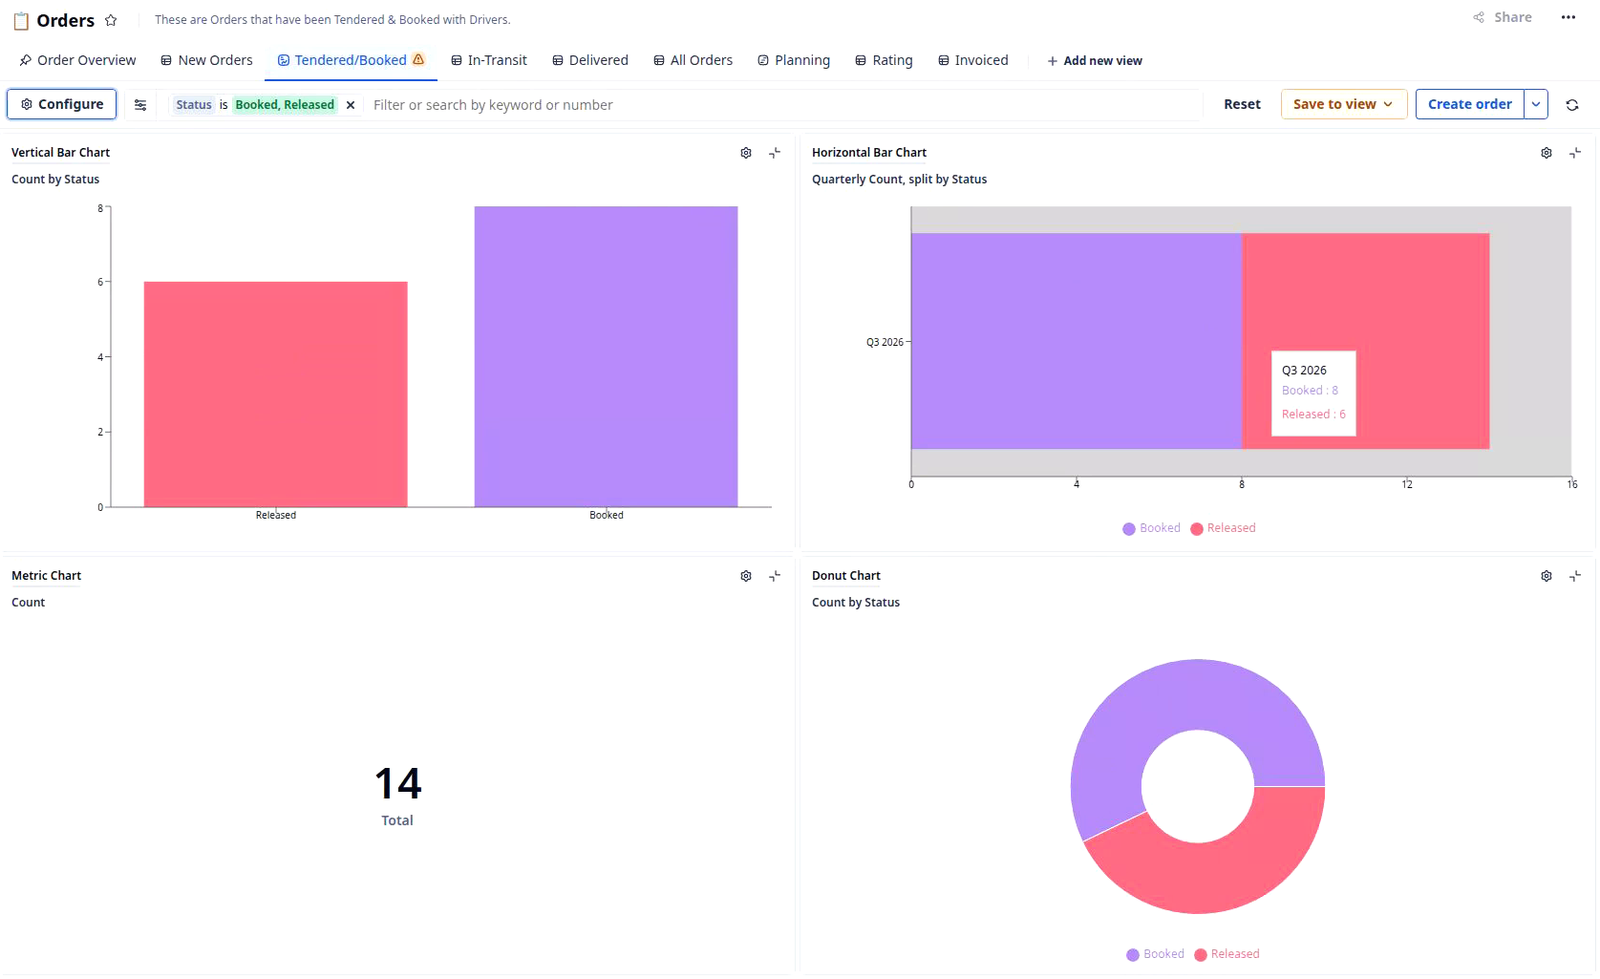
Take a view filtered to loads booked with a driver, for example Tendered/Booked, whose filter reads Status is Booked, Released. As a table it shows 14 orders. Switched to Charts, its Metric Chart reads 14 Total, and a bar chart grouped by Customer draws one bar for each customer with one of those 14 loads and nothing for the rest.
Each panel has its own Chart type, Group by and Formula: Count for how many, or a sum or average when the column is a number. A view with no charts yet opens on four starter panels, one of each kind below.
| Chart type | Good at | Trucking example |
|---|---|---|
| Vertical Bar Chart | Comparing a handful of groups side by side | Booked against Released on the Tendered/Booked view: 8 and 6 |
| Horizontal Bar Chart | Long labels such as customer names, or a date split by status | Quarterly Count, split by Status: Q3 2026, 8 booked and 6 released |
| Metric Chart | One number the team watches | Total: 14 loads booked with a driver |
| Donut Chart | Each group’s share of the whole | How much of the booked work is already released |
In Configure chart, both bar charts are the Bar type: Orientation turns one on its side, and Split by stacks each bar by a second column. Group by lists status, pick-list and date columns and connections to other records, such as Customer; a date column is counted by day, week, month, quarter or year.
How you set it up
The clip switches a filtered view to Charts and regroups one panel by Customer, then throws the draft away. The steps below also add a panel and save.
- Open the board and the view you want counted, for example Tendered/Booked on the Orders board. Get its filter right first: the charts will count exactly the records the table shows.
- Click Configure. Under Layout in Configure View, choose Charts, then press Escape to close the flyout. The view redraws as four starter panels, and the tab picks up a warning triangle because the change is still a draft on your screen.
- To add a panel, click Configure › Chart Layout › Edit, then the + at the right edge of a row. The new panel arrives as a Vertical Bar Chart counting by Status. A view holds up to three panels in a row and three rows. Click Done.
- Click the gear on a panel to open Configure chart. Set Chart type, then Group by, for example Customer: the panel re-reads Count by Customer and redraws with one bar per customer. Click anywhere outside the panel to close it. Escape does not.
- Click Save to view › Save to current view. The triangle clears and the tab opens as charts for everyone who uses the view. Reset discards the draft instead.
What to watch for
- A panel counts the view, so a filter change changes the chart. Edit the view’s filter and every panel redraws on the new set, and the panel heading still reads Count by Customer, with no hint of the filter behind it. If someone widens Tendered/Booked to take in delivered loads, its Total stops meaning loads booked with a driver. Name the view for what its filter keeps, and treat a filter edit on a chart view as editing the report.
- A chart never adds rows the view filtered out. Grouping by Customer shows the customers inside the filter, not every customer on the board. A customer with no booked loads gets no bar at all, so a missing bar means zero, not missing data. To compare against all orders, chart a view without that filter.
- Too many groups make a chart nobody can read. Group by a column with dozens of values, such as Customer on an unfiltered board, and every value gets its own bar or slice. With only eight customers the bar chart already prints two names under its bars, and a donut legend stops at six names and “…”. Group by a column with a handful of values, such as Status, or narrow the filter until the groups fit.
- The row count goes away. The Charts layout drops the table’s pager, so 1 - 14 of 14 no longer shows. The Metric Chart’s Total is your check: it should match what the view counted as a table. To change the view’s columns or sort, see board views.