Timeline views: plan Rose Rocket orders on a date axis
Set a board view's layout to Timeline and pick a start and an end date field in Timeline Settings, so each order is drawn on the axis where it is due.
On this page3 sections
What it does
Once you know what a board view saves, a timeline view is that view with its Layout set to Timeline: each record keeps its row on the left, and a date axis runs across the right, one column per day. A record is drawn on that axis as a card that starts on the day its start date field names. The view still decides which records get a row, so a timeline shows the plan for exactly the loads the filter keeps.
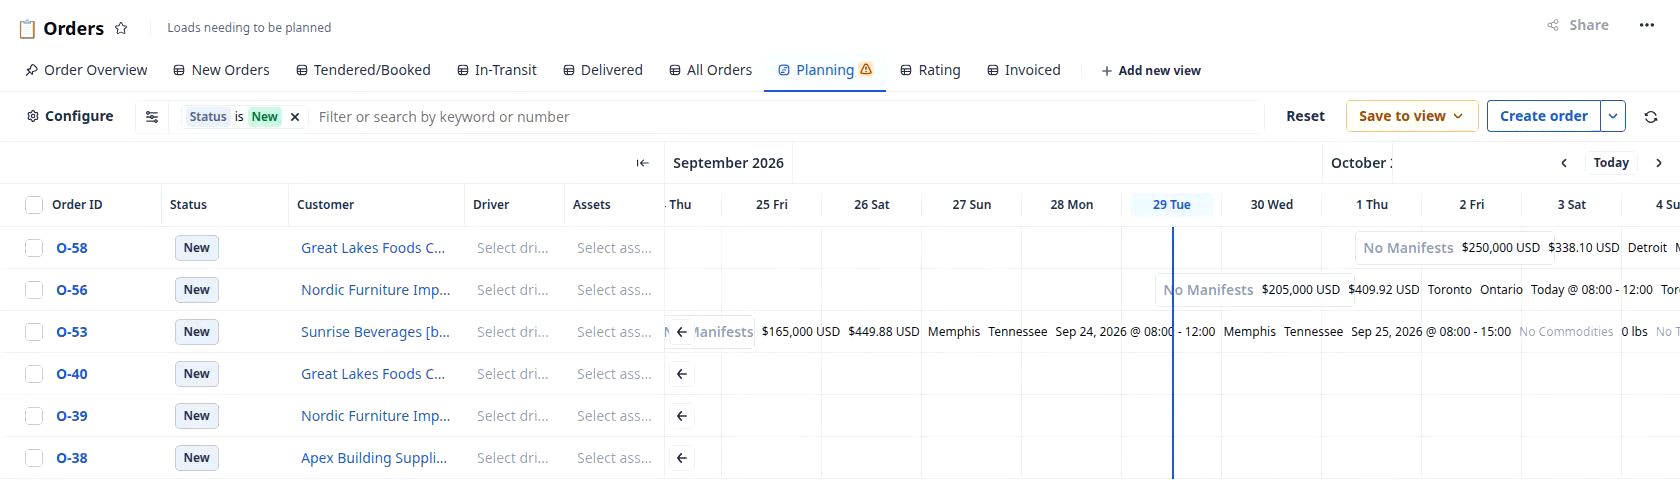
Take a view filtered to loads nobody has planned yet, for example Planning, with the subtitle Loads needing to be planned and the filter Status is New. With Requested pickup as its start date, each New order’s card lands on the day the customer wants it picked up, and the orders due this week stand apart from the ones due next week at a glance.
Three controls sit above the axis. Today brings the axis back to the current day, marked by a vertical line. Scroll table left and Scroll table right, the arrows either side of it, move the window earlier or later. A row whose card starts before the visible days shows a ← at the axis’s left edge instead of a card.
Default time axis sets how much time each column holds:
| Default time axis | Each column is | Good for |
|---|---|---|
| Day | One hour | Scheduling pickups within a day or two |
| Week | One day, under a month heading | Planning this week’s and next week’s loads |
| Month | One day, under a quarter heading | Delivery windows that run several weeks |
| Year | One month | Seasonal volume across the year |
How you set it up
The clip fills in the two dates on Planning and discards the draft rather than saving it. On screen the cards read as a chip on the pickup day followed by the order’s values, not as a solid bar from pickup to delivery.
- Open the board and the view you want to plan from, for example Planning on the Orders board. If the view is still a table, click Configure and choose Timeline under Layout in Configure View.
- In Configure View, click Timeline Settings. The panel reads Select start and end date fields to display records on the timeline.
- Click Start date and pick the field the work starts on, for example Requested pickup. The list shows the order’s date fields, such as Created at and Delivery ETA.
- Click End date and pick where it ends, for example Requested delivery. The cards draw on the board beside the panel as soon as both fields hold a value.
- Under Appearance, set Default time axis. Planning uses Week, one column per day. Hide field columns is left off in the clip, so the order’s columns stay on the left and each card prints the order’s values after it.
- Press Escape to close the panel. The tab now carries a warning triangle, because the change is a draft on your screen. Click Save to view › Save to current view to keep it for everyone who opens the view, or Reset to throw it away.
What to watch for
- No dates, no cards. Until both Start date and End date are set, no order has a place on the axis, which is why Planning opens as six rows beside an empty grid. The rows are not missing data. The view just has not been told which dates to draw from. A card is placed by the order’s own value in those fields, so pick fields your orders fill in when they are created: a New order has a requested pickup, but no actual pickup yet.
- The scale belongs to the view, not to you. The Default time axis is saved with the view, so everyone who opens Planning sees the same columns, and the toolbar has only Today and the two scroll arrows. Switching Week to Month and saving changes it for the whole team. If one person needs a wider window, give them their own view on the same board.
- A ← is a card you cannot see yet. Rows with only an arrow have a card that starts before the visible days. Click Scroll table left, or Today if you have scrolled away, before deciding a load has no dates.
- A timeline is a planning view, not a report. It draws one row per record and gives no totals. Over thousands of orders it is a long scroll nobody can read. Filter it to the loads that need a decision, as Planning does with Status is New, and use a Charts layout on another view when the question is how many. For filters, columns and the other layouts, see board views.